sherloc
Posted: 08/21/2012 Filed under: data studies, sherloc detective kit | Tags: Sherloc, weather Comments Off on sherloca bicycle-mounted roving detective kit for urban investigation
designer: Ryan Lewandowski
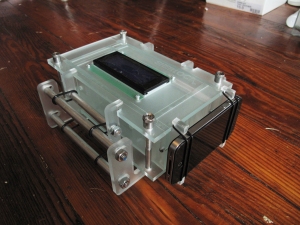
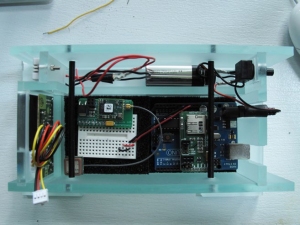
Fastened to a bike via a shock mount, Sherloc is a battery operated urban sensor device that records the temperature, humidity, light, and airborne particulate matter that is then geolocated with the onboard GPS device. This information is stored as a Comma Separated Value (CSV) file that can be easily mapped within Grasshopper to create parametrically driven data landscapes or surfaces for a city or site.
The device will take readings once every 2-4 seconds. Once your trip has been completed, just press the power switch to end the recording. To retrieve the recording, unscrew the top of the box and remove the MicroSD card from the shield on the Arduino. Plug it into your computer and you have a formatted CSV file that can be opened in Excel or read directly through Grasshopper!
Sherloc also has o-ring mounts for an iPhone. This is specifically for apps that record decibel levels and topography, but app-space contains many as-yet-unexplored regions…
shadow animation
Posted: 08/07/2012 Filed under: solar studies | Tags: DIVA, Ecotect, Geco, shadows, simulations Comments Off on shadow animationUsing either DIVA or Geco with Ecotect, it is easily possible to animate shadow volumes during the course of any day of the year.
shadow animation from lp on Vimeo.
test_solar_position definition
energy simulations
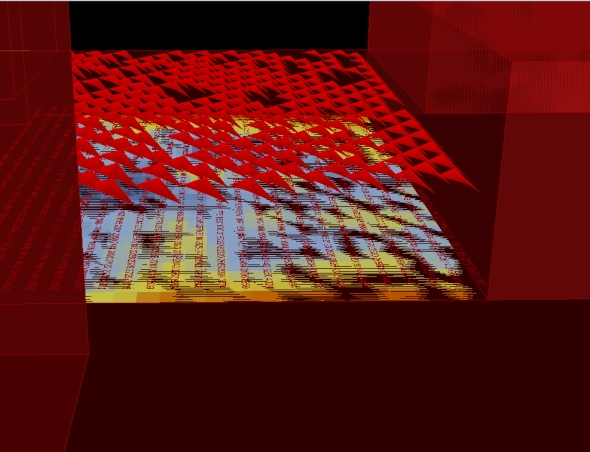
Posted: 08/06/2012 Filed under: solar studies | Tags: DIVA, illuminance, simulations Comments Off on energy simulationsConducting energy simulation within the grasshopper environment makes an iterative work flow much more simple. The example below, using the DIVA plug-in, shows illumination values (represented by a gradation from red to blue) under the red canopy. Note the data tags. These values are available to shape surface strategies.
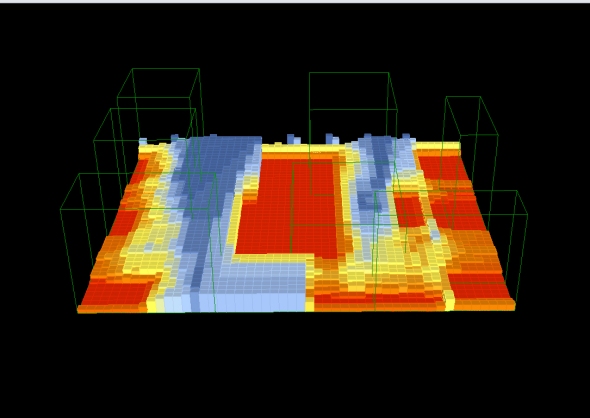
The example below uses the Geco plug-in to integrate with Ecotect. Here the total incident solar radiation is represented as a topography from red (hot) to blue (cool). The definition requires a .wea file.
plug-ins?
Posted: 08/03/2012 Filed under: data studies, solar studies | Tags: grasshopper plug-ins Comments Off on plug-ins? There is a constant two-way conversation between the developer, David Rutten, and Grasshopper users through the grasshopper forum, providing Rutten with first hand knowledge of the interests of people who work with this software. This special relationship with users has extended to outside developers who are encouraged to create plug-ins that expand the reach of the grasshopper platform. Expansions into territories outside mainstream architecture now include connections with database spreadsheets and tabular data available through the internet, ability to link with real-time data flows, connections to mapping platforms, connections to data resulting from energy simulations, the ability to interface with sensors and motors to create active physical prototypes, etc.
We have used many plug-ins in this work. Some of them, such as hoopsnake, kangaroo physics, mesh edit, paneling tools, and tree8, add to the general functionality of grasshopper. The plug-ins that pertain to the specific needs of this research are:
tabular data: gHowl and LunchBox
internet connections: gHowl, Slingshot!
real time data and active physical prototypes: Firefly
See also the Data Study and Solar Study file tree PDFs. These reveal the plug-ins used for particular downloadable definitions.
delta architecture
Posted: 08/01/2012 Filed under: solar studies | Tags: delta bot Comments Off on delta architectureA delta robot is a three-legged device, capable of precise control, and well suited to the fast execution of light-duty tasks. It has potential for controlling shade structures as well as apertures in surfaces.
Delta Robot Facade from lp on Vimeo.
The delta modules track the sun between 30 and 45 degrees from surface normals. Then they slowly return to their home position.
Here is an individual module:
delta robot from lp on Vimeo.
The definition below mathematically computes the position of a robotic arm that is restricted within a two-dimensional plane of movement.
It uses basic trigonometric equations instead of parametric relationships between geometric forms.
For an set of delta bot definitions for grasshopper, see Brian Harms’ delta bot challenge on the grasshopper forum. For an explanation of inverse kinematics, see this site: learn about robots
robotic arm via inverse kinematics definition
delta robot controlled by a wii nunchuck
solar study
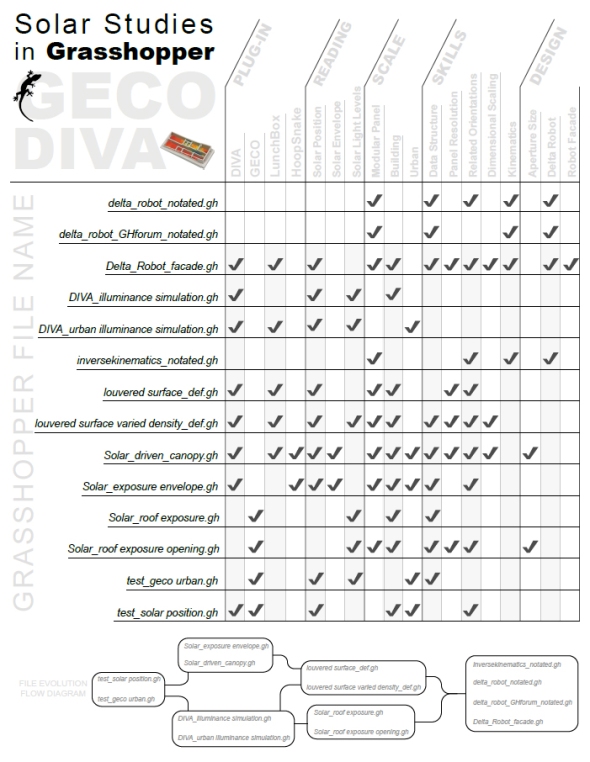
Posted: 07/31/2012 Filed under: solar studies | Tags: grasshopper plug-ins Comments Off on solar studyThis website explores a set of key tools for constructing weather. Various simulation software, linking to Grasshopper, is available to bring rigor to this process. Here is a file tree of a annotated definitions, PDFs, and accessory files:
data study
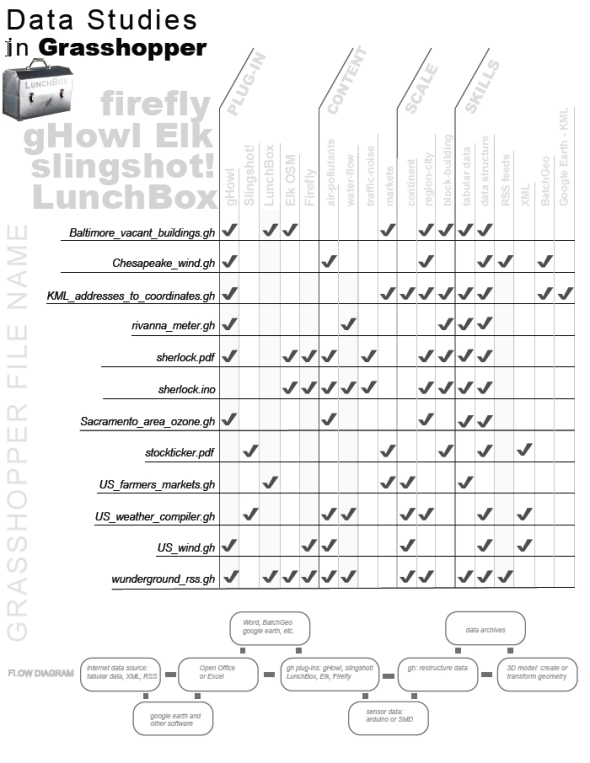
Posted: 07/31/2012 Filed under: XML definitions | Tags: grasshopper plug-ins Comments Off on data studyThis website explores a set of key tools for simultaneous (rather than sequential) analytic and design investigations. Here is a file tree of a annotated definitions, PDFs, and accessory files:
Walk Log
Posted: 07/31/2012 Filed under: data studies, sherloc detective kit | Tags: firefly, gHowl, LunchBox, Sherloc, weather Comments Off on Walk LogSherloc is a bicycle-mounted roving detective kit for urban investigation. Taking transects through a city, it records GPS coordinates, light, humidity, sound levels, and airborne particulate concentrations. This data is brought into Grasshopper through gHowl or LunchBox components where it provides a means to visualize these wild urban energies as a medium for constructing weather. This building scale data is a key addition to the context provided by the NOAA and Weather Underground.
Here is Sherloc’s maiden voyage through some not-so-urban lawns and pastures near Batesville, Virginia.
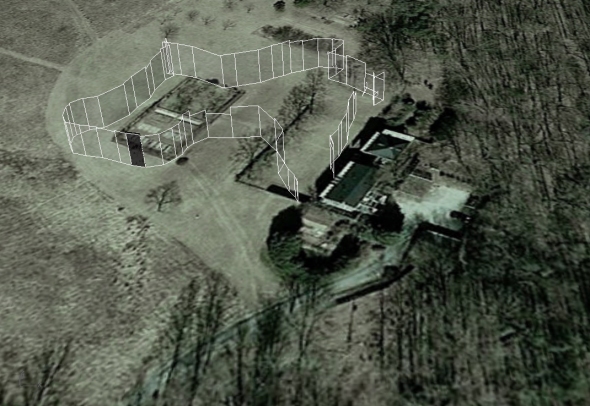 The white framed extrusions show light level readings. The black extrusion captures an instant of the frame-by-frame reading of the data.
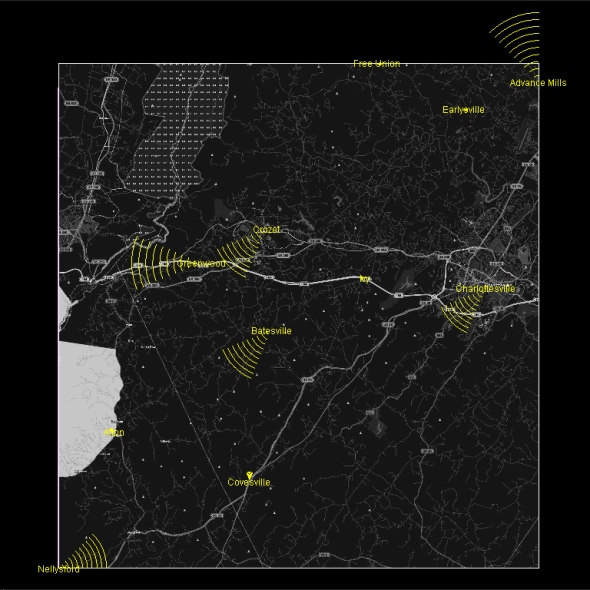
local weather feeds
Posted: 07/27/2012 Filed under: data studies | Tags: Elk, gHowl, live data, OpenStreetMap, weather, weather underground Comments Off on local weather feedsThe Weather Underground has many associated personal stations that provide streaming weather data. These report temperature, humidity, barometric pressure, conditions, wind direction, and wind speed. In some areas there are enough stations to reveal local microclimates. You can create your own array of weather stations by adding to Weather Underground’s network.
Weather stations coordinates are mapped to XYZ space with a gHowl component. The yellow cones are proportional to the wind speed reported at each station.
albemarle wind from lp on Vimeo
Wind speeds were recorded for several Albemarle County stations on July 28, 2012 between noon and 1:00 PM. Readings were taken about twice per minute from the weather underground RSS feed using the gHowl plug-in for GrassHopper. Wind speeds ranged from 0 to 7 mph during this interval. Note that these summer breezes could not be described as having a prevailing direction!
US wind
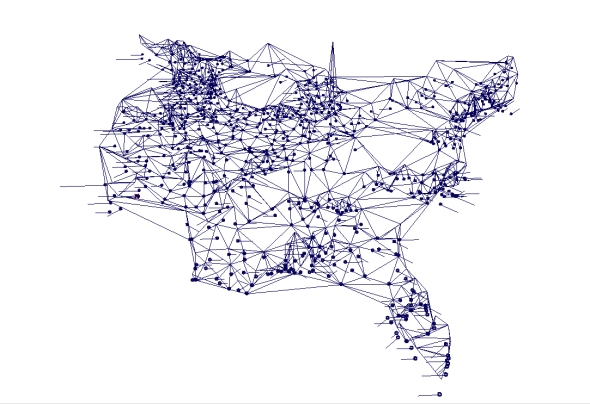
Posted: 07/27/2012 Filed under: data studies | Tags: Arthur Mamou-Mani, firefly, gHowl, live data, weather Comments Off on US windThis is a simple definition that parses live wind data for Eastern US from the boy genius weather feed list.
Wind is represented as a vector extending from each weather station. Wind is also shown as a delaunay topography. Note the sharp wind peak in Michigan! (This definition is based on a temperature map by Arthur Mamou-Mani.)
You must be logged in to post a comment.